Putting Climate Data into the Context of Human Lifespan

We humans have a hard time comprehending our future.

Fortunately, there’s a lot of great science being done about our collective future. Unfortunately, this data is typically presented in a way that feels removed from our human experience. No matter how real data is — if we don’t perceive it as having a direct, tangible impact on our own lives (and those of our friends and family) it will continue to be viewed as abstract and removed from our life experience.

Creativity can help answer the call to connect seemingly abstract data to people’s emotions.

Arlene is exploring opportunities to annotate existing climate data to help people see themselves within the data. During a recent artist residency at MASS MoCA, Arlene worked on a series of projects to put our own life spans into climate data.
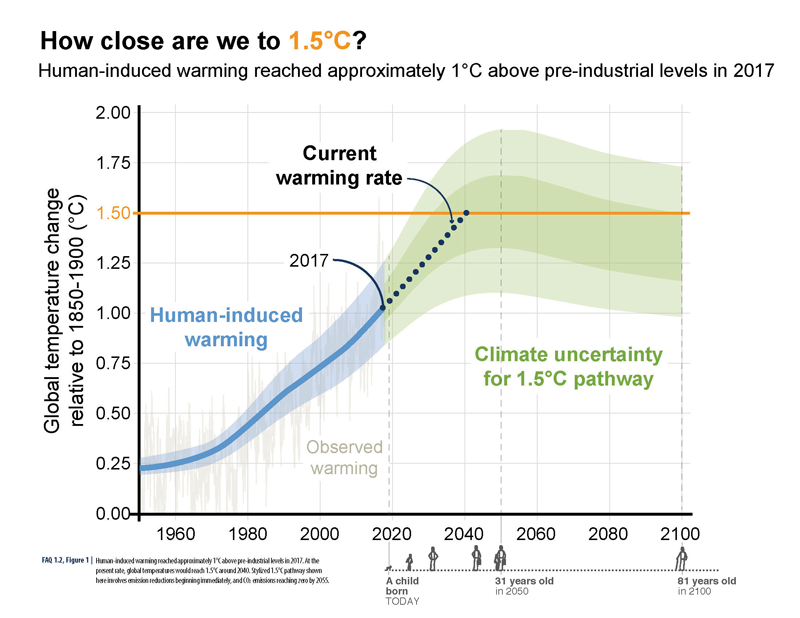
How Close Are We to 1.5˚C?ABOVE: A visual human lifespan is added to contextualize a series of future dates.

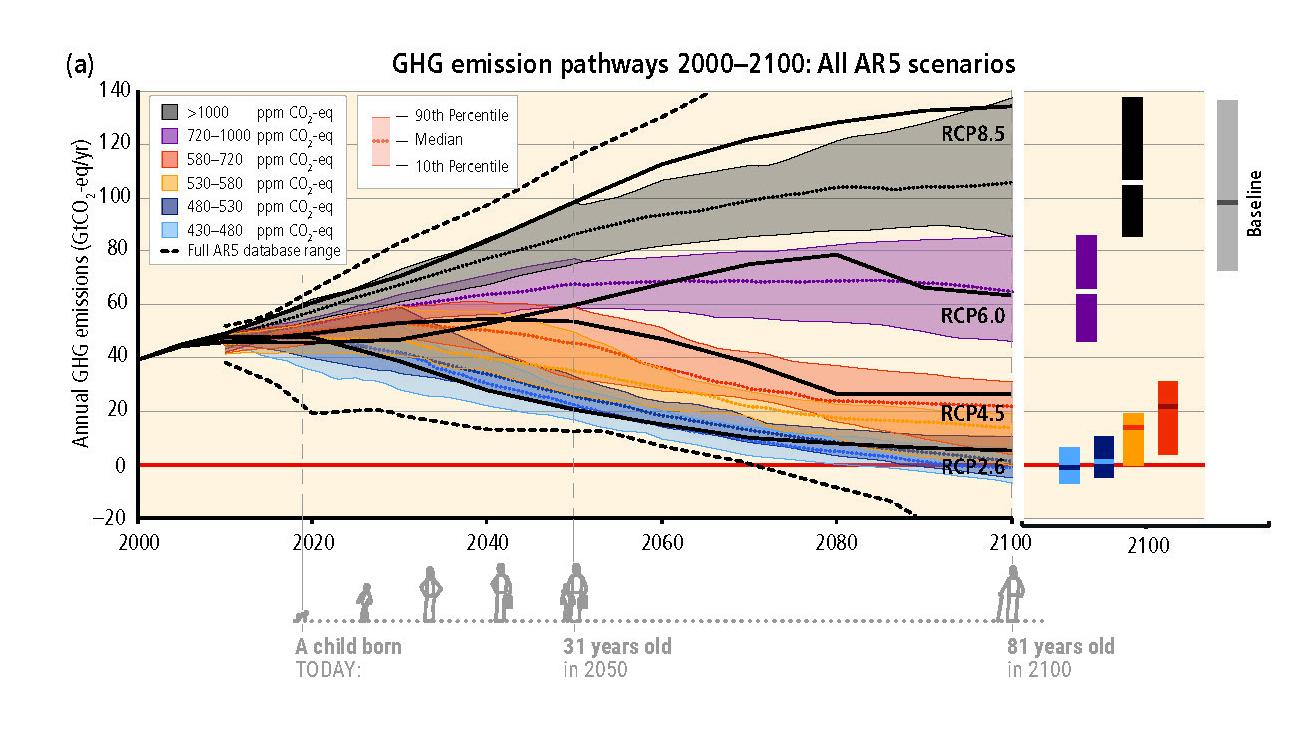
One project was to annotate graphs from Intergovernmental Panel on Climate Change (IPCC) reports that denote future climate trends. The graphs are annotated with a small illustration of an average human lifespan — starting with a child born today. The annotation shows how old the child will be in key years that are in the data. The inclusion of a human life span with this data helps remind us of the grand scale of the global changes that are being graphed, and how these changes will continue to impact our children, grandchildren, nieces and nephews long after we’re gone.

BELOW: Additional examples of human life spans visualized as part of a graph’s timeline.
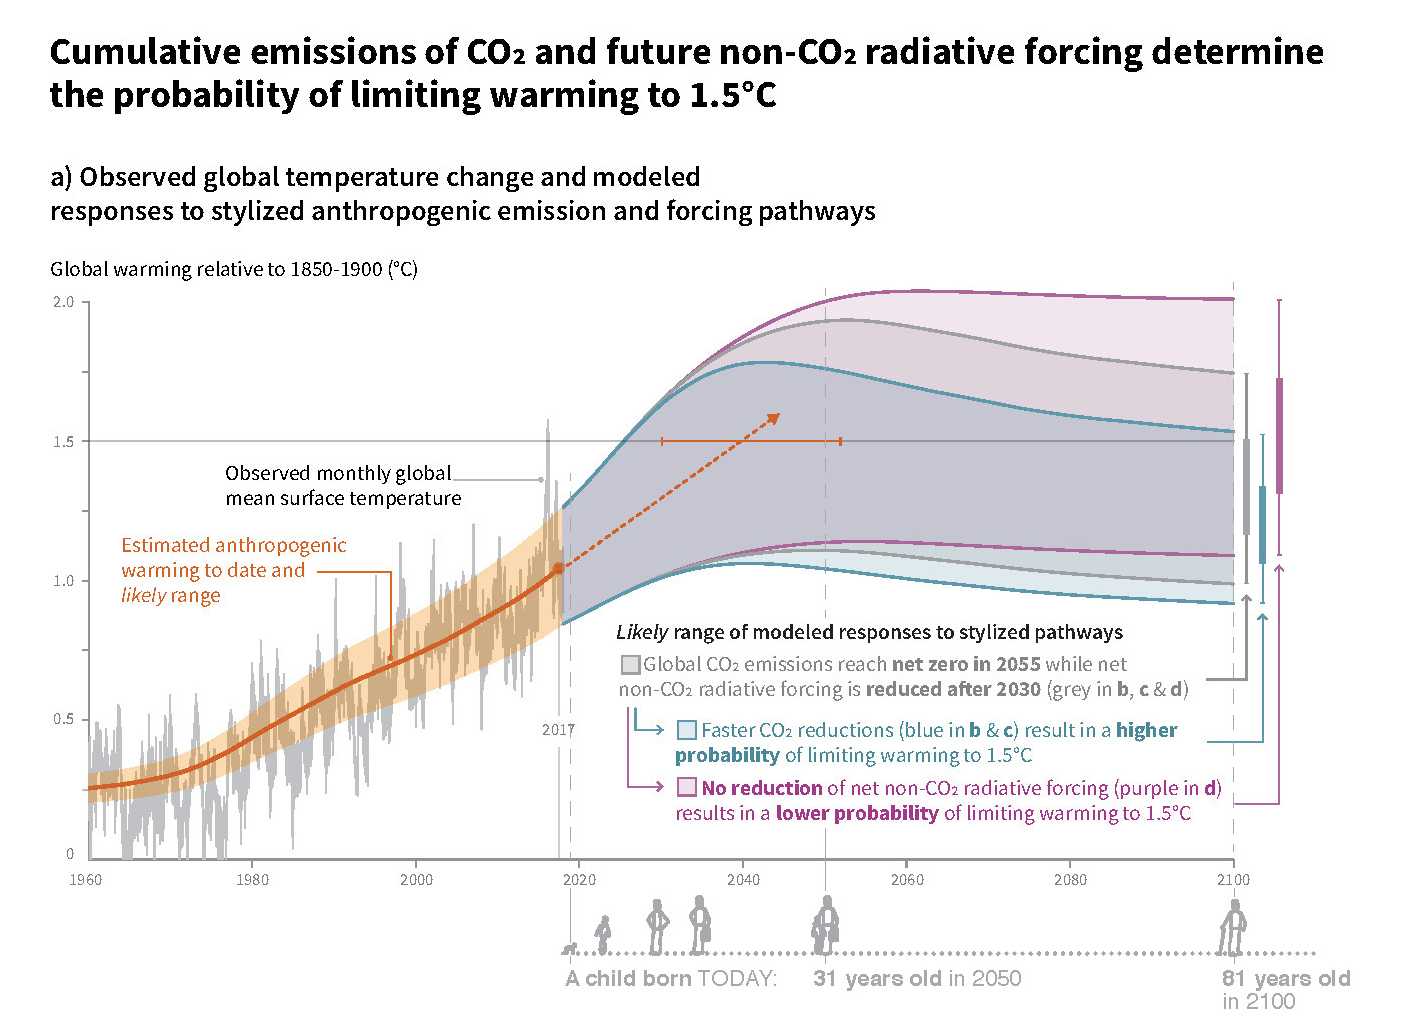
Cumulative Emissions of CO2

GHG Emission Pathways

BELOW: Detail of the timeline with life span.
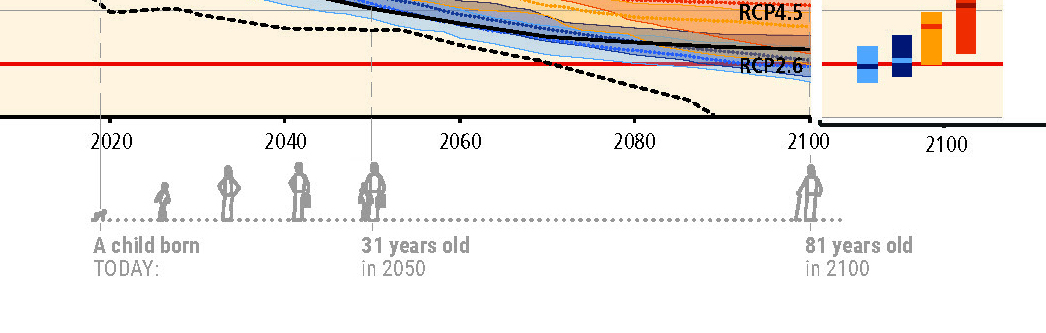
Detail of GHG Emission Pathways

Webinar: ‘Visual Storytelling: Putting Data into Context’

Audience First: Behavior Change and Values-Based Climate Communication

Connecting with audiences based on the values that are behind a desired activity/behavior can be more powerful than highlighting benefits to the audience. This values-driven approach has been shown to have more impact than ‘saving the environment’ or even ‘cost savings’ messages, according to the founder of Climate Outreach, George Marshall, who presented at Behavior, Energy and Climate Change conference (BECC). (See a synopsis of Arlene’s ‘Public Engagement through Art’ presentation on our previous newsletter.)


For example, instead of touting the cost-savings and environmental benefits of home insulation, consider:

“Your home is great. It’s where you bring up your family. It’s where you share some of the best moments of your life. You want to keep it cozy. Insulation is a good way to do that.”

This ‘audience first’ approach closely resembles ‘Start with Why’ and the design and communication processes that I use in practice, and with my students.

In our communication work, we orient every aspect of a message around the intended recipient: story structure, visual style, and language used. So, I can relate to focusing on an audience’s need.

Marshall’s presentation made the point that prioritizing the audiences’ values (even above the benefits of a product/service) throughout this messaging, can create impact on sustainability-related behavior change. 


Pollinator-Friendly Solar at the Fair

For this year’s Minnesota State Fair, we’ve teamed up with Fresh Energy and Connexus Energy to create a three-dimensional display to draw attention to a new way of thinking about renewable energy: Pollinator-friendly solar.

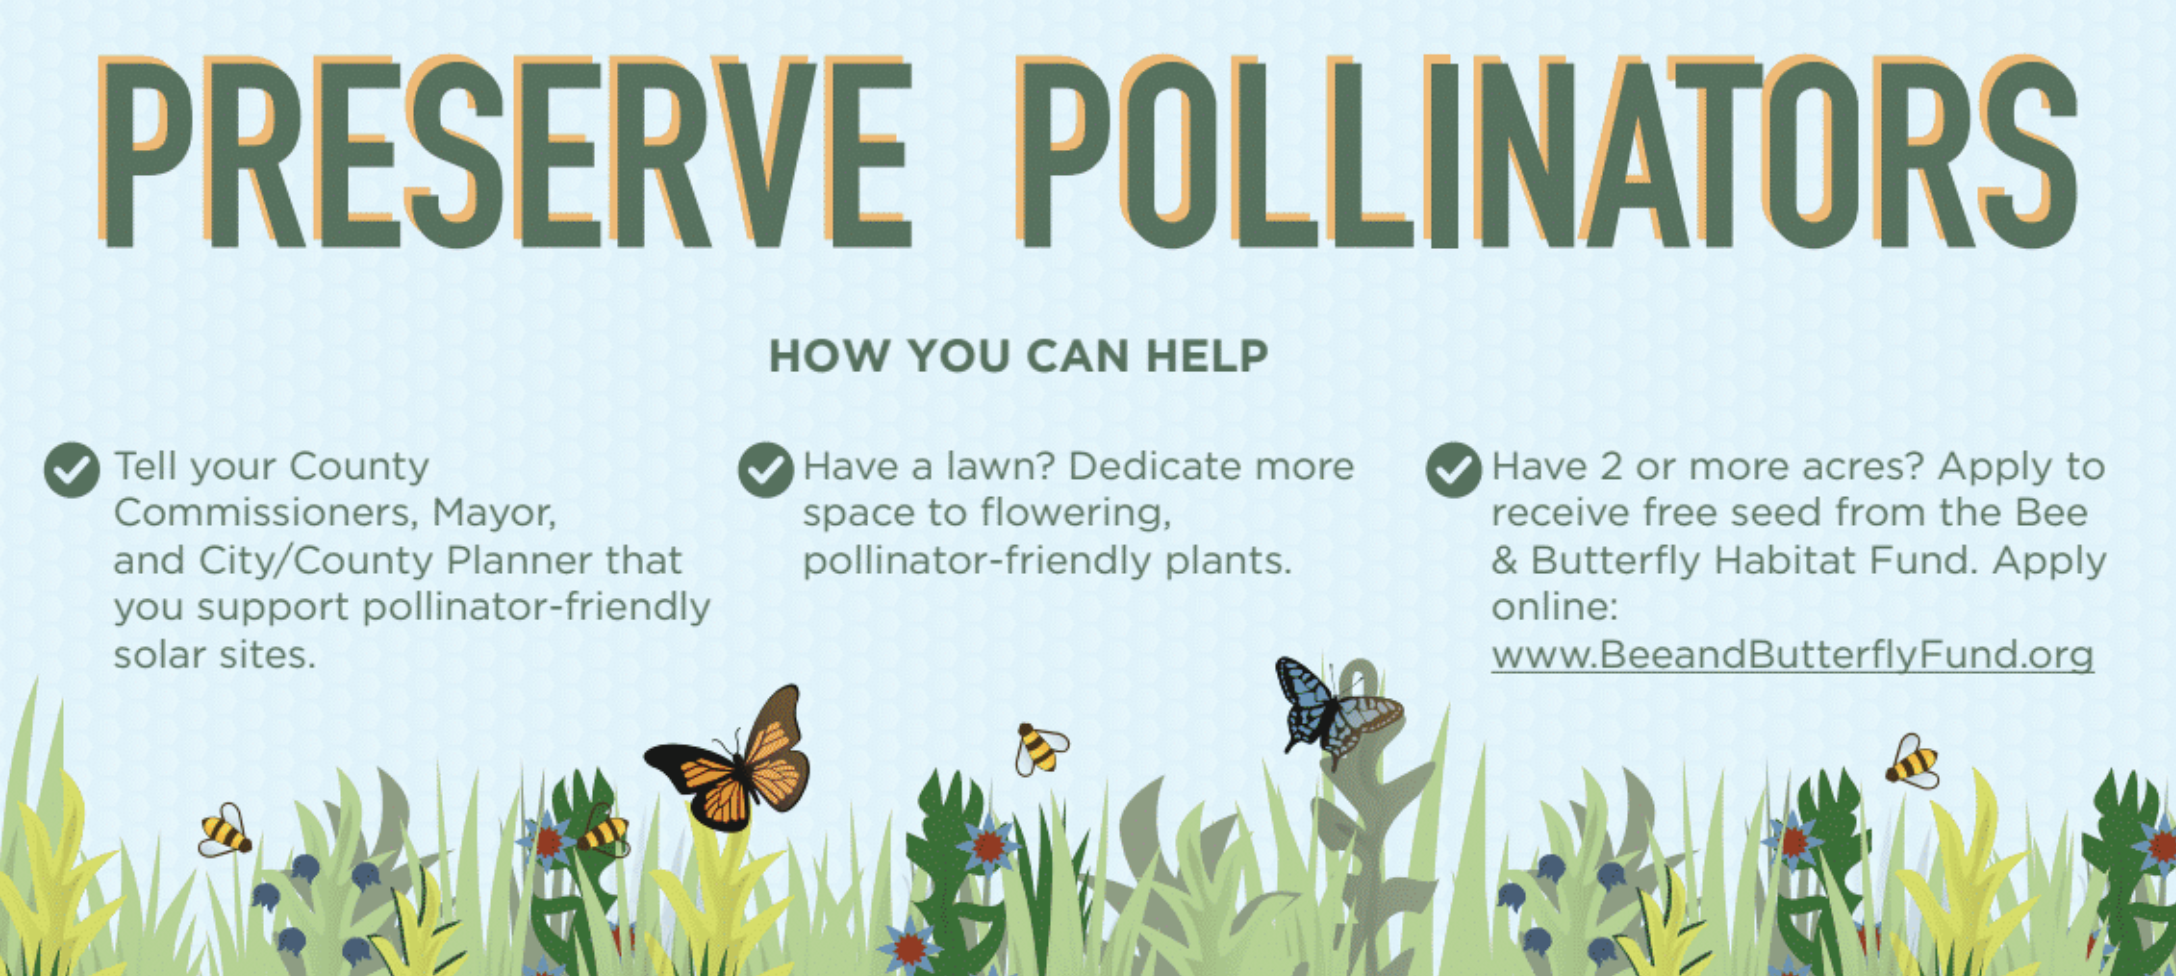
Preserve Pollinators

Infographic poster from the Minnesota State Fair display.

Our display, part of “The Common Table: Minnesota Eats” exhibit in the Agriculture Horticulture Building, highlights how our region is leading the way in policymaking and on-farm efforts to bring more pollinator habitat to otherwise underutilized land. You can see the exhibit in-person from August 23 through September 3, along with nearly two million other fair-goers (who famously flock to the event for all kinds of foods and creations “on a stick”). Of course, our sticks — a series of cutout landscape elements and hide-and-seek pollinators for you to find — will be glued down, but you’re sure to learn a lot about the powerful partnership of pollinators and solar energy!

In Mpls: Material Matters exhibit & American Swedish Inst. Fence

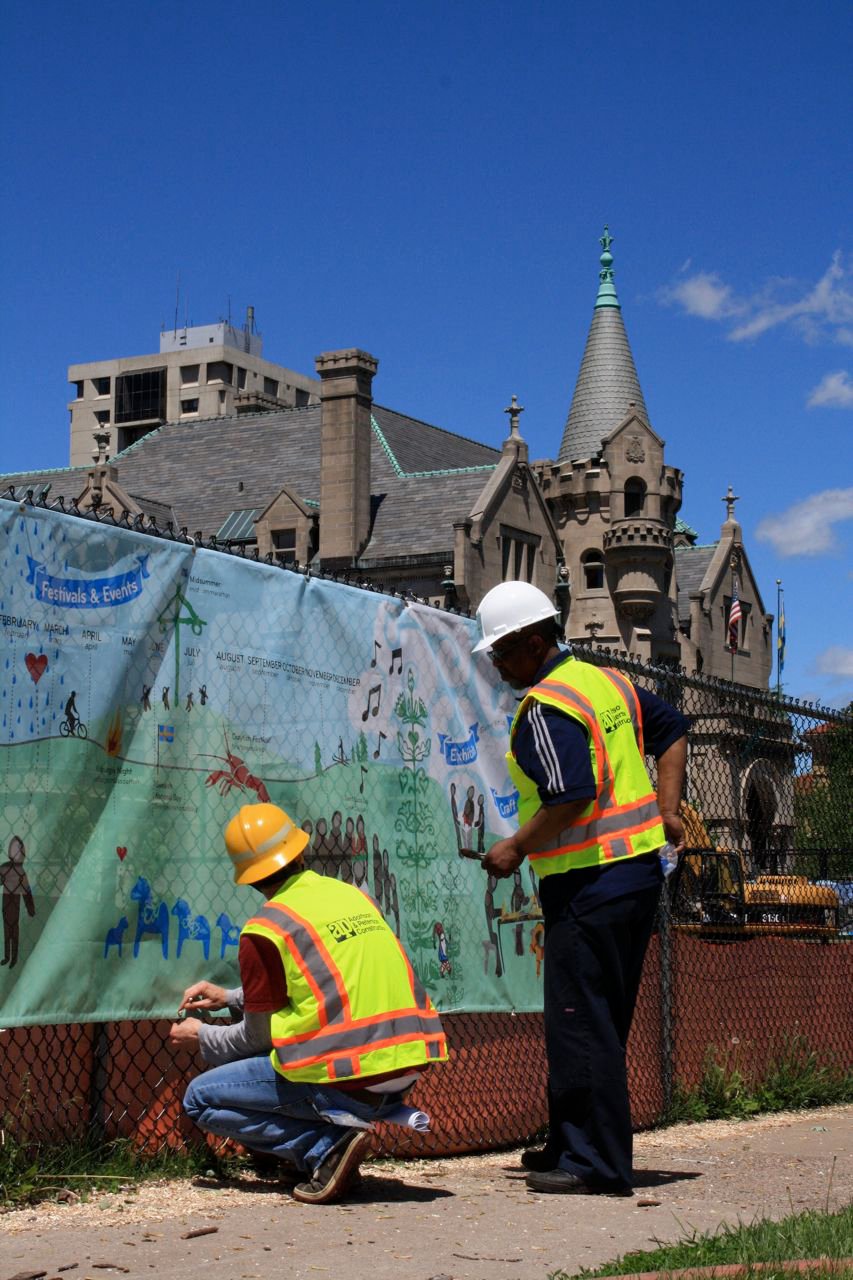
The fence is up at the American Swedish Institute! I designed a back-story, repeating banner for the construction fence to show what the upcoming addition’s ‘LEED’ certification means and to acquaint passer-bys with happenings at the museum and in Swedish culture. Although the museum is closed during the construction, the fence is there for you to visit. See it in the Phillips neighborhood.

 
Also, the ‘T-Shirt-that Tells it’s Own Story’ and some shawls I developed together with master craftsmen in rural India are on exhibit at ‘Material Matters’ now at MCAD.

Food Tracability: Article

By this Washington Post article, it appears food traceability is set to go main-stream.

The opportunities for communicating the social and environmental sustainability behind such foods are huge. It’s fascinating how it may be the food safety concerns that drive us toward opening to transparency. – Once those doors are open, so many additional communication possibilities exist.

These ideas for the food system are also good validation for the TraceProduct.Info project I initiated as part of an Art(ists) on the Verge fellowship.  More info on the project here.

systems for food tracability

Graphic from the Washington Post

See Behind the Scenes at Västra Hamnen

Come visit the parascope to ‘see behind’ into the sustainability systems in the Västra Hamnen area of Malmö. The installation is accessible today through Monday Dec. 13 [map]. The project was done as part of a artist-residency at MEDEA Collaborative Research Initiative in Sweden. More information here.

The parascope itself was developed by a collaboration between Unsworn Industries and Malmö Stad.

View the sustainability systems behind-the-scenes of Vastra Hamnen, Malmo

PARASCOPE ON LOCATION IN VÄSTRA HAMNEN. MALMÖ

MEDEA Talk on ‘Visualizing Sustainability’

Arlene Birt presenting at MEDEA in Malmö, Sweden on Dec.10 (15:00-17:00 Central European time).

Arlene will present two projects that she’s done as artist-in-residence at MEDEA and a behind-the-scenes view on her work on how to visualize ‘background stories’. One project is a visual mapping of the sustainability-oriented systems at work within the Västra Hamnen area of the city through a collaboration with Unsworn Industries to show this information using the parascope technology they’ve developed. Another project visually communicates the benefits of bicycling – in terms of CO2 saved, money saved and calories burned.

Details on the talk here. There will also be a live-stream of the talk.

Artist Residency to Visualize Impacts in Malmö, Sweden

Arlene has begun an artist residency at interactive center for new media MEDEA, where she will develop work to visualize the impacts/benefits of bicycling for the Västra Hamnen area of Malmö in order to encourage and celebrate a culture of bicycling.

More on the progress of the project, which will run Oct-Dec 2010, is posted on the MEDEA site.

sketch of visualizing sustainaiblity in bicycling

WORK-IN-PROGRESS

I, Pencil – A Sustainability Story From 1958

I, Pencil by Leonard Read, is an essay on the life cycle of a pencil. Written in a way that references all the strings attached and people involved in the back-story of this simple, everyday object; this story is an excellent text to tie products to global social and environmental concerns. And it was written in 1958.

“Actually, millions of human beings have had a hand in my creation, no one of whom even knows more than a very few of the others.”

I, Pencil is referenced in this TED talk by Matt Ridley about the collective effort that leads to innovation,